Planet Fitness, Inc. Announces Third Quarter 2019 Results
Today, Planet Fitness, Inc. (NYSE: PLNT) reported financial results for its third quarter ended September 30, 2019.
Third Quarter Fiscal 2019 Highlights
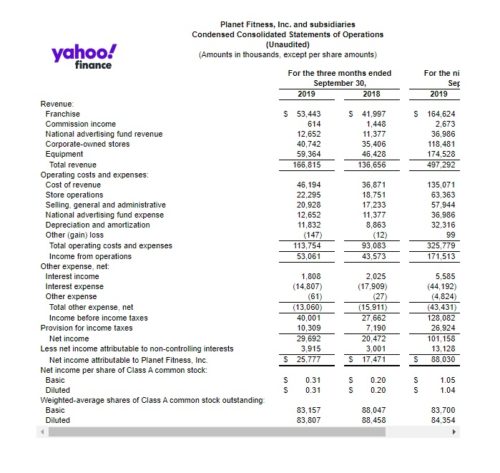
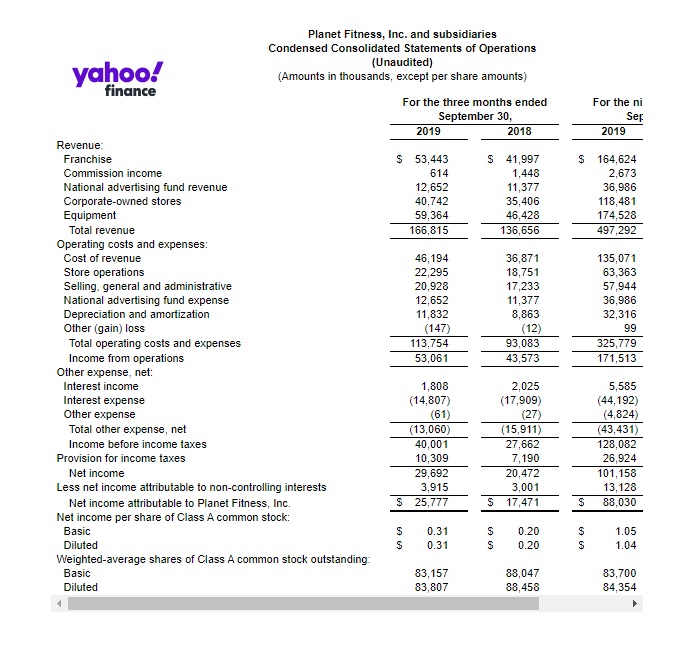
- Total revenue increased from the prior year period by 22.1% to $166.8 million.
- System-wide same store sales increased 7.9%.
- Net income attributable to Planet Fitness, Inc. was $25.8 million, or $0.31 per diluted share, compared to net income attributable to Planet Fitness, Inc. of $17.5 million, or $0.20 per diluted share in the prior year period.
- Net income increased 45.0% to $29.7 million, compared to net income of $20.5 millionin the prior year period.
- Adjusted net income(1) increased 19.5% to $33.1 million, or $0.36 per diluted share, compared to $27.7 million, or $0.28 per diluted share in the prior year period.
- Adjusted EBITDA(1) increased 22.2% to $65.7 million from $53.8 million in the prior year period.
- 41 new Planet Fitness stores were opened during the period, bringing system-wide total stores to 1,899 as of September 30, 2019.
(1) Adjusted net income and Adjusted EBITDA are non-GAAP measures. For reconciliations of Adjusted EBITDA and Adjusted net income to U.S. GAAP (“GAAP”) net income see “Non-GAAP Financial Measures” accompanying this press release.
“We delivered another quarter of very solid results,” stated Chris Rondeau, Chief Executive Officer. “High-single digit system-wide same store sales, combined with accelerated new store openings and our franchisees’ continued commitment to re-equip their existing clubs with new equipment, fueled a 22% increase in total revenue. The third quarter was also highlighted by our highest-attended franchisee conference to date with over 1,500 attendees from across the system coming together to share ideas on how to strengthen the Planet Fitness brand, enhance the member experience and drive new member sign ups. Based on several factors including our experienced franchisees and their ability to execute, the significant amount of projected store expansion still ahead, and our increasing marketing spend, I am confident that the business is well positioned to drive continued growth and increased profitability.”
Operating Results for the Third Quarter Ended September 30, 2019
For the third quarter 2019, total revenue increased $30.2 million or 22.1% to $166.8 million from $136.7 million in the prior year period which included system-wide same store sales growth of 7.9%. By segment:
- Franchise segment revenue increased $11.9 million or 21.7% to $66.7 million from $54.8 million in the prior year period, driven primarily by higher royalty revenue as a result of new stores opened since July 1, 2018, an 8.1% increase in same store sales, and a higher average royalty rate;
- Corporate-owned stores segment revenue increased $5.3 million or 15.1% to $40.7 million from $35.4 million in the prior year period, $2.7 million of which is from corporate-owned stores opened or acquired since July 1, 2018, and another $1.4 million of which is from corporate-owned same store sales growth of 4.9%, and higher annual fee revenue of $1.1 million; and
- Equipment segment revenue increased $12.9 million or 27.9% to $59.4 million from $46.4 million in the prior year period, driven by an increase in replacement equipment sales to existing franchisee-owned stores.
For the third quarter of 2019, net income attributable to Planet Fitness, Inc. was $25.8 million, or $0.31 per diluted share, compared to net income attributable to Planet Fitness, Inc. of $17.5 million, or $0.20 per diluted share in the prior year period. Net income was $29.7 million in the third quarter of 2019 compared to $20.5 million in the prior year period. Adjusted net income increased 19.5% to $33.1 million, or $0.36 per diluted share, from $27.7 million, or $0.28 per diluted share in the prior year period. Adjusted net income has been adjusted to reflect a normalized federal income tax rate of 26.6% for the current year period and 26.3% for the comparable prior year period and excludes certain non-cash and other items that we do not consider in the evaluation of ongoing operational performance (see “Non-GAAP Financial Measures”).
Adjusted EBITDA, which is defined as net income before interest, taxes, depreciation and amortization, adjusted for the impact of certain non-cash and other items that we do not consider in the evaluation of ongoing operational performance (see “Non-GAAP Financial Measures”), increased 22.2% to $65.7 million from $53.8 million in the prior year period.
Segment EBITDA represents our Total Segment EBITDA broken down by the Company’s reportable segments. Total Segment EBITDA is equal to EBITDA, which is defined as net income before interest, taxes, depreciation and amortization (see “Non-GAAP Financial Measures”).
- Franchise segment EBITDA increased $7.3 million or 19.6% to $44.3 million driven by royalties from franchised stores opened since July 1, 2018, a higher average royalty rate and higher same store sales of 8.1%;
- Corporate-owned stores segment EBITDA increased $1.5 million or 9.9% to $16.8 million driven primarily by an increase in corporate-owned same store sales of 4.9%, higher annual fee revenue and from additional clubs opened or acquired since July 1, 2018; and
- Equipment segment EBITDA increased by $4.1 million or 42.3% to $13.7 million driven by an increase in replacement equipment sales to existing franchisee-owned stores.
2019 Outlook
For the year ending December 31, 2019, the Company now expects:
- Total revenue to increase approximately 19% as compared to the year ended December 31, 2018, up from prior guidance of approximately 18%;
- Total new store equipment sales in the high end of the range of 250 to 260;
- System-wide same store sales of approximately 8.6%, up from prior guidance of approximately 8%;
- Adjusted net income to increase approximately 21% as compared to the year ended December 31, 2018, up from prior guidance of approximately 20%; and
- Adjusted net income per diluted share to increase approximately 28% to $1.56 as compared to the year ended December 31, 2018, up from prior guidance of approximately 26%.
Presentation of Financial Measures
Planet Fitness, Inc. (the “Company”) was formed in March 2015 for the purpose of facilitating the initial public offering (the “IPO”) and related recapitalization transactions that occurred in August 2015, and in order to carry on the business of Pla-Fit Holdings, LLC (“Pla-Fit Holdings”) and its subsidiaries. As the sole managing member of Pla-Fit Holdings, the Company operates and controls all of the business and affairs of Pla-Fit Holdings, and through Pla-Fit Holdings, conducts its business. As a result, the Company consolidates Pla-Fit Holdings’ financial results and reports a non-controlling interest related to the portion of Pla-Fit Holdings not owned by the Company.
The financial information presented in this press release includes non-GAAP financial measures such as EBITDA, Segment EBITDA, Adjusted EBITDA, Adjusted net income and Adjusted net income per share, diluted, to provide measures that we believe are useful to investors in evaluating the Company’s performance. These non-GAAP financial measures are supplemental measures of the Company’s performance that are neither required by, nor presented in accordance with GAAP. These financial measures should not be considered in isolation or as substitutes for GAAP financial measures such as net income or any other performance measures derived in accordance with GAAP. In addition, in the future, the Company may incur expenses or charges such as those added back to calculate Adjusted EBITDA, Adjusted net income and Adjusted net income per share, diluted. The Company’s presentation of Adjusted EBITDA, Adjusted net income and Adjusted net income per share, diluted, should not be construed as an inference that the Company’s future results will be unaffected by similar amounts or other unusual or nonrecurring items. See the tables at the end of this press release for a reconciliation of EBITDA, Adjusted EBITDA, Total Segment EBITDA, Adjusted net income, and Adjusted net income per share, diluted, to their most directly comparable GAAP financial measure.
Same store sales refers to year-over-year sales comparisons for the same store sales base of both corporate-owned and franchisee-owned stores. We define the same store sales base to include those stores that have been open and for which monthly membership dues have been billed for longer than 12 months. We measure same store sales based solely upon monthly dues billed to members of our corporate-owned and franchisee-owned stores.
The non-GAAP financial measures used in our full-year outlook will differ from net income and net income per share, diluted, determined in accordance with GAAP in ways similar to those described in the reconciliations at the end of this press release. We do not provide guidance for net income or net income per share, diluted, determined in accordance with GAAP or a reconciliation of guidance for Adjusted net income and Adjusted net income per share, diluted, to the most directly comparable GAAP measure because we are not able to predict with reasonable certainty the amount or nature of all items that will be included in our net income and net income per share, diluted, for the year ending December 31, 2019. These items are uncertain, depend on many factors and could have a material impact on our net income and net income per share, diluted, for the year ending December 31, 2019.
Investor Conference Call
The Company will hold a conference call at 4:30 pm (ET) on November 7, 2019 to discuss the news announced in this press release. A live webcast of the conference call will be accessible at www.planetfitness.com via the “Investor Relations” link. The webcast will be archived on the website for one year.
About Planet Fitness
Founded in 1992 in Dover, NH, Planet Fitness is one of the largest and fastest-growing franchisors and operators of fitness centers in the United States by number of members and locations. As of September 30, 2019, Planet Fitness had more than 14.1 million members and 1,899 stores in 50 states, the District of Columbia, Puerto Rico, Canada, the Dominican Republic, Panama and Mexico. The Company’s mission is to enhance people’s lives by providing a high-quality fitness experience in a welcoming, non-intimidating environment, which we call the Judgement Free Zone®. More than 95% of Planet Fitness stores are owned and operated by independent business men and women.
Forward-Looking Statements
This press release contains “forward-looking statements” within the meaning of the federal securities laws, which involve risks and uncertainties. Forward-looking statements include the Company’s statements with respect to expected future performance presented under the heading “2019 Outlook,” those attributed to the Company’s Chief Executive Officer in this press release and other statements, estimates and projections that do not relate solely to historical facts. Forward-looking statements can be identified by words such as “believe,” “expect,” “goal,” “plan,” “will,” “prospects,” “future,” “ahead,” “projected,” “strategy” and similar references to future periods, although not all forward-looking statements include these identifying words. Forward-looking statements are not assurances of future performance. Instead, they are based only on the Company’s current beliefs, expectations and assumptions regarding the future of the business, future plans and strategies, projections, anticipated events and trends, the economy and other future conditions. Because forward-looking statements relate to the future, they are subject to inherent uncertainties, risks and changes in circumstances that are difficult to predict and many of which are outside of the Company’s control. Actual results and financial condition may differ materially from those indicated in the forward-looking statements. Important factors that could cause our actual results to differ materially include risks and uncertainties associated with competition in the fitness industry, the Company’s and franchisees’ ability to attract and retain new members, the Company’s and franchisees’ ability to identify and secure suitable sites for new franchise stores, changes in consumer demand, changes in equipment costs, the Company’s ability to expand into new markets domestically and internationally, operating costs for the Company and franchisees generally, availability and cost of capital for franchisees, acquisition activity, developments and changes in laws and regulations, our substantial increased indebtedness as a result of our refinancing and securitization transactions and our ability to incur additional indebtedness or refinance that indebtedness in the future, our future financial performance and our ability to pay principal and interest on our indebtedness, our corporate structure and tax receivable agreements, failures, interruptions or security breaches of the Company’s information systems or technology, general economic conditions and the other factors described in the Company’s annual report on Form 10-K for the year ended December 31, 2018, and the Company’s other filings with the Securities and Exchange Commission. In light of the significant risks and uncertainties inherent in forward-looking statements, investors should not place undue reliance on forward-looking statements, which reflect the Company’s views only as of the date of this press release. Except as required by law, neither the Company nor any of its affiliates or representatives undertake any obligation to provide additional information or to correct or update any information set forth in this release, whether as a result of new information, future developments or otherwise.
| Planet Fitness, Inc. and subsidiaries | ||||||||
| Condensed Consolidated Statements of Operations | ||||||||
| (Unaudited) | ||||||||
| (Amounts in thousands, except per share amounts) | ||||||||
| For the three months ended September 30, | For the nine months ended September 30, | |||||||
| 2019 | 2018 | 2019 | 2018 | |||||
| Revenue: | ||||||||
| Franchise | $ | 53,443 | $ | 41,997 | $ | 164,624 | $ | 129,575 |
| Commission income | 614 | 1,448 | 2,673 | 5,012 | ||||
| National advertising fund revenue | 12,652 | 11,377 | 36,986 | 32,997 | ||||
| Corporate-owned stores | 40,742 | 35,406 | 118,481 | 102,365 | ||||
| Equipment | 59,364 | 46,428 | 174,528 | 128,589 | ||||
| Total revenue | 166,815 | 136,656 | 497,292 | 398,538 | ||||
| Operating costs and expenses: | ||||||||
| Cost of revenue | 46,194 | 36,871 | 135,071 | 100,114 | ||||
| Store operations | 22,295 | 18,751 | 63,363 | 55,154 | ||||
| Selling, general and administrative | 20,928 | 17,233 | 57,944 | 52,066 | ||||
| National advertising fund expense | 12,652 | 11,377 | 36,986 | 32,997 | ||||
| Depreciation and amortization | 11,832 | 8,863 | 32,316 | 25,947 | ||||
| Other (gain) loss | (147) | (12) | 99 | 958 | ||||
| Total operating costs and expenses | 113,754 | 93,083 | 325,779 | 267,236 | ||||
| Income from operations | 53,061 | 43,573 | 171,513 | 131,302 | ||||
| Other expense, net: | ||||||||
| Interest income | 1,808 | 2,025 | 5,585 | 2,480 | ||||
| Interest expense | (14,807) | (17,909) | (44,192) | (35,725) | ||||
| Other expense | (61) | (27) | (4,824) | (338) | ||||
| Total other expense, net | (13,060) | (15,911) | (43,431) | (33,583) | ||||
| Income before income taxes | 40,001 | 27,662 | 128,082 | 97,719 | ||||
| Provision for income taxes | 10,309 | 7,190 | 26,924 | 23,335 | ||||
| Net income | 29,692 | 20,472 | 101,158 | 74,384 | ||||
| Less net income attributable to non-controlling interests | 3,915 | 3,001 | 13,128 | 11,158 | ||||
| Net income attributable to Planet Fitness, Inc. | $ | 25,777 | $ | 17,471 | $ | 88,030 | $ | 63,226 |
| Net income per share of Class A common stock: | ||||||||
| Basic | $ | 0.31 | $ | 0.20 | $ | 1.05 | $ | 0.72 |
| Diluted | $ | 0.31 | $ | 0.20 | $ | 1.04 | $ | 0.72 |
| Weighted-average shares of Class A common stock outstanding: | ||||||||
| Basic | 83,157 | 88,047 | 83,700 | 87,727 | ||||
| Diluted | 83,807 | 88,458 | 84,354 | 88,064 |
| Planet Fitness, Inc. and subsidiaries | ||||
| Condensed Consolidated Balance Sheets | ||||
| (Unaudited) | ||||
| (Amounts in thousands, except per share amounts) | ||||
| September 30, 2019 | December 31, 2018 | |||
| Assets | ||||
| Current assets: | ||||
| Cash and cash equivalents | $ | 219,752 | $ | 289,431 |
| Restricted cash | 30,499 | 30,708 | ||
| Accounts receivable, net of allowance for bad debts of $37 and $84 at September 30, 2019 and December 31, 2018, respectively | 29,398 | 38,960 | ||
| Inventory | 2,612 | 5,122 | ||
| Restricted assets – national advertising fund | 657 | — | ||
| Prepaid expenses | 8,649 | 4,947 | ||
| Other receivables | 9,232 | 12,548 | ||
| Other current assets | 5,471 | 6,824 | ||
| Total current assets | 306,270 | 388,540 | ||
| Property and equipment, net of accumulated depreciation of $70,083 as of September 30, 2019 and $53,086 as of December 31, 2018 | 131,454 | 114,367 | ||
| Right of use assets, net | 127,746 | — | ||
| Intangible assets, net | 227,575 | 234,330 | ||
| Goodwill | 206,752 | 199,513 | ||
| Deferred income taxes | 418,745 | 414,841 | ||
| Other assets, net | 1,690 | 1,825 | ||
| Total assets | $ | 1,420,232 | $ | 1,353,416 |
| Liabilities and stockholders’ deficit | ||||
| Current liabilities: | ||||
| Current maturities of long-term debt | $ | 12,000 | $ | 12,000 |
| Accounts payable | 23,037 | 30,428 | ||
| Accrued expenses | 25,737 | 32,384 | ||
| Equipment deposits | 8,566 | 7,908 | ||
| Restricted liabilities – national advertising fund | 657 | — | ||
| Deferred revenue, current | 24,638 | 23,488 | ||
| Payable pursuant to tax benefit arrangements, current | 25,506 | 24,765 | ||
| Other current liabilities | 15,780 | 430 | ||
| Total current liabilities | 135,921 | 131,403 | ||
| Long-term debt, net of current maturities | 1,155,049 | 1,160,127 | ||
| Deferred rent, net of current portion | — | 10,083 | ||
| Lease liabilities, net of current portion | 127,646 | — | ||
| Deferred revenue, net of current portion | 31,532 | 26,374 | ||
| Deferred tax liabilities | 2,067 | 2,303 | ||
| Payable pursuant to tax benefit arrangements, net of current portion | 407,884 | 404,468 | ||
| Other liabilities | 2,250 | 1,447 | ||
| Total noncurrent liabilities | 1,726,428 | 1,604,802 | ||
| Stockholders’ equity (deficit): | ||||
| Class A common stock, $.0001 par value – 300,000 authorized, 81,773 and 83,584 shares issued and outstanding as of September 30, 2019 and December 31, 2018, respectively | 8 | 9 | ||
| Class B common stock, $.0001 par value – 100,000 authorized, 8,562 and 9,448 shares issued and outstanding as of September 30, 2019 and December 31, 2018, respectively | 1 | 1 | ||
| Accumulated other comprehensive income | 189 | 94 | ||
| Additional paid in capital | 27,240 | 19,732 | ||
| Accumulated deficit | (466,032) | (394,410) | ||
| Total stockholders’ deficit attributable to Planet Fitness, Inc. | (438,594) | (374,574) | ||
| Non-controlling interests | (3,523) | (8,215) | ||
| Total stockholders’ deficit | (442,117) | (382,789) | ||
| Total liabilities and stockholders’ deficit | $ | 1,420,232 | $ | 1,353,416 |
| Planet Fitness, Inc. and subsidiaries | ||||
| Condensed Consolidated Statements of Cash Flows | ||||
| (Unaudited) | ||||
| (Amounts in thousands, except per share amounts) | ||||
| For the nine months ended September 30, | ||||
| 2019 | 2018 | |||
| Cash flows from operating activities: | ||||
| Net income | $ | 101,158 | $ | 74,384 |
| Adjustments to reconcile net income to net cash provided by operating activities: | ||||
| Depreciation and amortization | 32,316 | 25,947 | ||
| Amortization of deferred financing costs | 4,014 | 2,041 | ||
| Amortization of favorable leases | — | 280 | ||
| Amortization of asset retirement obligations | 178 | — | ||
| Amortization of interest rate caps | — | 1,170 | ||
| Deferred tax expense | 15,666 | 19,654 | ||
| Loss on extinguishment of debt | — | 4,570 | ||
| Loss (gain) on re-measurement of tax benefit arrangement | 4,638 | (354) | ||
| Provision for bad debts | 13 | 8 | ||
| Loss on reacquired franchise rights | — | 360 | ||
| (Gain) loss on disposal of property and equipment | (84) | 542 | ||
| Equity-based compensation | 3,565 | 4,137 | ||
| Changes in operating assets and liabilities, excluding effects of acquisitions: | ||||
| Accounts receivable | 12,779 | 10,922 | ||
| Due to and due from related parties | (344) | 3,174 | ||
| Inventory | 2,509 | (3,450) | ||
| Other assets and other current assets | (4,628) | 4,972 | ||
| Accounts payable and accrued expenses | (12,939) | 2,426 | ||
| Other liabilities and other current liabilities | 1,510 | (2,869) | ||
| Income taxes | 3,047 | 1,028 | ||
| Payable pursuant to tax benefit arrangements | (17,476) | (21,706) | ||
| Equipment deposits | 658 | 4,950 | ||
| Deferred revenue | 6,103 | 7,544 | ||
| Leases and deferred rent | 54 | 4,156 | ||
| Net cash provided by operating activities | 152,737 | 143,886 | ||
| Cash flows from investing activities: | ||||
| Additions to property and equipment | (37,138) | (18,601) | ||
| Acquisition of franchises | (14,801) | (45,752) | ||
| Proceeds from sale of property and equipment | 84 | 196 | ||
| Purchase of intellectual property | (300) | — | ||
| Net cash used in investing activities | (52,155) | (64,157) | ||
| Cash flows from financing activities: | ||||
| Principal payments on capital lease obligations | (59) | (35) | ||
| Proceeds from issuance of long-term debt | — | 1,200,000 | ||
| Repayment of long-term debt | (9,000) | (709,469) | ||
| Payment of deferred financing and other debt-related costs | — | (27,191) | ||
| Exercise of stock options and ESPP proceeds | 1,892 | 1,106 | ||
| Repurchase and retirement of Class A common stock | (157,945) | (42,090) | ||
| Dividend equivalent payments | (229) | (881) | ||
| Distributions to Continuing LLC Members | (5,499) | (5,369) | ||
| Net cash (used in) provided by financing activities | (170,840) | 416,071 | ||
| Effects of exchange rate changes on cash and cash equivalents | 370 | (234) | ||
| Net (decrease) increase in cash, cash equivalents and restricted cash | (69,888) | 495,566 | ||
| Cash, cash equivalents and restricted cash, beginning of period | 320,139 | 113,080 | ||
| Cash, cash equivalents and restricted cash, end of period | $ | 250,251 | $ | 608,646 |
| Supplemental cash flow information: | ||||
| Net cash paid for income taxes | $ | 9,061 | $ | 3,777 |
| Cash paid for interest | $ | 40,335 | $ | 20,015 |
| Non-cash investing activities: | ||||
| Non-cash additions to property and equipment | $ | 4,837 | $ | 2,217 |
Planet Fitness, Inc. and subsidiaries
Non-GAAP Financial Measures
(Unaudited)
(Amounts in thousands, except per share amounts)
To supplement its consolidated financial statements, which are prepared and presented in accordance with GAAP, the Company uses the following non-GAAP financial measures: EBITDA, Total Segment EBITDA, Adjusted EBITDA, Adjusted net income and Adjusted net income per share, diluted (collectively, the “non-GAAP financial measures”). The Company believes that these non-GAAP financial measures, when used in conjunction with GAAP financial measures, are useful to investors in evaluating our operating performance. These non-GAAP financial measures presented in this release are supplemental measures of the Company’s performance that are neither required by, nor presented in accordance with GAAP. These financial measures should not be considered in isolation or as substitutes for GAAP financial measures such as net income or any other performance measures derived in accordance with GAAP. In addition, in the future, the Company may incur expenses or charges such as those added back to calculate Adjusted EBITDA, Adjusted net income and Adjusted net income per share, diluted. The Company’s presentation of Adjusted EBITDA, Adjusted net income, and Adjusted net income per share, diluted, should not be construed as an inference that the Company’s future results will be unaffected by unusual or nonrecurring items.
EBITDA, Segment EBITDA and Adjusted EBITDA
We refer to EBITDA and Adjusted EBITDA as we use these measures to evaluate our operating performance and we believe these measures provide useful information to investors in evaluating our performance. We have also disclosed Segment EBITDA as an important financial metric utilized by the Company to evaluate performance and allocate resources to segments in accordance with ASC 280, Segment Reporting. We define EBITDA as net income before interest, taxes, depreciation and amortization. Segment EBITDA sums to Total Segment EBITDA which is equal to the Non-GAAP financial metric EBITDA. We believe that EBITDA, which eliminates the impact of certain expenses that we do not believe reflect our underlying business performance, provides useful information to investors to assess the performance of our segments as well as the business as a whole. Our board of directors also uses EBITDA as a key metric to assess the performance of management. We define Adjusted EBITDA as net income before interest, taxes, depreciation and amortization, adjusted for the impact of certain additional non-cash and other items that we do not consider in our evaluation of ongoing performance of the Company’s core operations. These items include certain purchase accounting adjustments, stock offering-related costs, and certain other charges and gains. We believe that Adjusted EBITDA is an appropriate measure of operating performance in addition to EBITDA because it eliminates the impact of other items that we believe reduce the comparability of our underlying core business performance from period to period and is therefore useful to our investors in comparing the core performance of our business from period to period.
A reconciliation of Adjusted EBITDA to net income, the most directly comparable GAAP measure, is set forth below.
| Three months ended September 30, | Nine months ended September 30, | |||||||
| 2019 | 2018 | 2019 | 2018 | |||||
| (in thousands) | ||||||||
| Net income | $ | 29,692 | $ | 20,472 | $ | 101,158 | $ | 74,384 |
| Interest income | (1,808) | (2,025) | (5,585) | (2,480) | ||||
| Interest expense | 14,807 | 17,909 | 44,192 | 35,725 | ||||
| Provision for income taxes | 10,309 | 7,190 | 26,924 | 23,335 | ||||
| Depreciation and amortization | 11,832 | 8,863 | 32,316 | 25,947 | ||||
| EBITDA | $ | 64,832 | $ | 52,409 | $ | 199,005 | $ | 156,911 |
| Purchase accounting adjustments-revenue(1) | 275 | 527 | 524 | 941 | ||||
| Purchase accounting adjustments-rent(2) | 108 | 198 | 348 | 548 | ||||
| Loss on reacquired franchise rights(3) | — | 10 | — | 360 | ||||
| Transaction fees(4) | — | 254 | — | 290 | ||||
| Severance costs(5) | — | — | — | 352 | ||||
| Pre-opening costs(6) | 826 | 370 | 1,021 | 853 | ||||
| Tax benefit arrangement remeasurement(7) | (214) | — | 4,638 | (354) | ||||
| Other(8) | (104) | 19 | 55 | 1,039 | ||||
| Adjusted EBITDA | $ | 65,723 | $ | 53,787 | $ | 205,591 | $ | 160,940 |
| (1) | Represents the impact of revenue-related purchase accounting adjustments associated with the acquisition of Pla-Fit Holdings on November 8, 2012 by TSG (the “2012 Acquisition”). At the time of the 2012 Acquisition, the Company maintained a deferred revenue account, which consisted of deferred ADA fees, deferred franchise fees, and deferred enrollment fees that the Company billed and collected upfront but recognizes for U.S. GAAP purposes at a later date. In connection with the 2012 Acquisition, it was determined that the carrying amount of deferred revenue was greater than the fair value assessed in accordance with ASC 805—Business Combinations, which resulted in a write-down of the carrying value of the deferred revenue balance upon application of acquisition push-down accounting under ASC 805. These amounts represent the additional revenue that would have been recognized in these periods if the write-down to deferred revenue had not occurred in connection with the application of acquisition pushdown accounting. |
| (2) | Represents the impact of rent-related purchase accounting adjustments. In accordance with guidance in ASC 805 – Business Combinations, in connection with the 2012 Acquisition, the Company’s deferred rent liability was required to be written off as of the acquisition date and rent was recorded on a straight-line basis from the acquisition date through the end of the lease term. This resulted in higher overall recorded rent expense each period than would have otherwise been recorded had the deferred rent liability not been written off as a result of the acquisition push down accounting applied in accordance with ASC 805. Adjustments of $44, $105, $173 and $272 in the three and nine months ended September 30, 2019 and 2018, respectively, reflect the difference between the higher rent expense recorded in accordance with U.S. GAAP since the acquisition and the rent expense that would have been recorded had the 2012 Acquisition not occurred. Adjustments of $64, $93, $216 and $276 in the three and nine months ended September 30, 2019 and 2018, respectively, are due to the amortization of favorable and unfavorable leases. All of the rent related purchase accounting adjustments are adjustments to rent expense which is included in store operations on our consolidated statements of operations. |
| (3) | Represents the impact of a non-cash loss recorded in accordance with ASC 805 – Business Combinations related to our acquisition of six franchisee-owned stores on January 1, 2018. The loss recorded under GAAP represents the difference between the fair value of the reacquired franchise rights and the contractual terms of the reacquired franchise rights and is included in other (gain) loss on our consolidated statements of operations. |
| (4) | Represents transaction fees and expenses that could not be capitalized related to the issuance of our Series 2018-1 Senior Notes in the three and nine months ended September 30, 2018. |
| (5) | Represents severance expense recorded in connection with an equity award modification. |
| (6) | Represents costs associated with new corporate-owned stores incurred prior to the store opening, including payroll-related costs, rent and occupancy expenses, marketing and other store operating supply expenses. |
| (7) | Represents gains and losses related to the adjustment of our tax benefit arrangements primarily due to changes in our effective tax rate. |
| (8) | Represents certain other charges and gains that we do not believe reflect our underlying business performance. In the nine months ended September 30, 2018, this amount includes expense of $590 related to the write off of certain assets that were being tested for potential use across the system. |
A reconciliation of Segment EBITDA to Total Segment EBITDA is set forth below.
| Three months ended September 30, | Nine months ended September 30, | |||||||
| (in thousands) | 2019 | 2018 | 2019 | 2018 | ||||
| Segment EBITDA | ||||||||
| Franchise | $ | 44,328 | $ | 37,075 | $ | 141,548 | $ | 113,793 |
| Corporate-owned stores | 16,799 | 15,279 | 50,505 | 42,115 | ||||
| Equipment | 13,741 | 9,654 | 40,920 | 28,579 | ||||
| Corporate and other | (10,036) | (9,599) | (33,968) | (27,576) | ||||
| Total Segment EBITDA(1) | $ | 64,832 | $ | 52,409 | $ | 199,005 | $ | 156,911 |
| (1) | Total Segment EBITDA is equal to EBITDA. |
Adjusted Net Income and Adjusted Net Income per Diluted Share
Our presentation of adjusted net income assumes that all net income is attributable to Planet Fitness, Inc., which assumes the full exchange of all outstanding Holdings Units for shares of Class A common stock of Planet Fitness, Inc., adjusted for certain non-recurring items that we do not believe directly reflect our core operations. Adjusted net income per share, diluted, is calculated by dividing Adjusted net income by the total shares of Class A common stock outstanding plus any dilutive options and restricted stock units as calculated in accordance with GAAP and assuming the full exchange of all outstanding Holdings Units and corresponding Class B common stock as of the beginning of each period presented. Adjusted net income and Adjusted net income per share, diluted, are supplemental measures of operating performance that do not represent, and should not be considered, alternatives to net income and earnings per share, as calculated in accordance with GAAP. We believe Adjusted net income and Adjusted net income per share, diluted, supplement GAAP measures and enable us to more effectively evaluate our performance period-over-period. A reconciliation of Adjusted net income to net income, the most directly comparable GAAP measure, and the computation of Adjusted net income per share, diluted, are set forth below.
| Three months ended September 30, | Nine months ended September 30, | |||||||
| (in thousands, except per share amounts) | 2019 | 2018 | 2019 | 2018 | ||||
| Net income | $ | 29,692 | $ | 20,472 | $ | 101,158 | $ | 74,384 |
| Provision for income taxes, as reported | 10,309 | 7,190 | 26,924 | 23,335 | ||||
| Purchase accounting adjustments-revenue(1) | 275 | 527 | 524 | 941 | ||||
| Purchase accounting adjustments-rent(2) | 108 | 198 | 348 | 548 | ||||
| Loss on reacquired franchise rights(3) | — | 10 | — | 360 | ||||
| Transaction fees(4) | — | 254 | — | 290 | ||||
| Loss on extinguishment of debt(5) | — | 4,570 | — | 4,570 | ||||
| Severance costs(6) | — | — | — | 352 | ||||
| Pre-opening costs(7) | 826 | 370 | 1,021 | 853 | ||||
| Tax benefit arrangement remeasurement(8) | (214) | — | 4,638 | (354) | ||||
| Other(9) | (104) | 19 | 55 | 1,039 | ||||
| Purchase accounting amortization(10) | 4,146 | 3,934 | 12,429 | 11,776 | ||||
| Adjusted income before income taxes | $ | 45,038 | $ | 37,544 | $ | 147,097 | $ | 118,094 |
| Adjusted income taxes(11) | 11,980 | 9,874 | 39,128 | 31,059 | ||||
| Adjusted net income | $ | 33,058 | $ | 27,670 | $ | 107,969 | $ | 87,035 |
| Adjusted net income per share, diluted | $ | 0.36 | $ | 0.28 | $ | 1.16 | $ | 0.88 |
| Adjusted weighted-average shares outstanding(12) | 92,386 | 98,462 | 93,153 | 98,615 |
| (1) | Represents the impact of revenue-related purchase accounting adjustments associated with the 2012 Acquisition. At the time of the 2012 Acquisition, the Company maintained a deferred revenue account, which consisted of deferred ADA fees, deferred franchise fees, and deferred enrollment fees that the Company billed and collected upfront but recognizes for U.S. GAAP purposes at a later date. In connection with the 2012 Acquisition, it was determined that the carrying amount of deferred revenue was greater than the fair value assessed in accordance with ASC 805—Business Combinations, which resulted in a write-down of the carrying value of the deferred revenue balance upon application of acquisition push-down accounting under ASC 805. These amounts represent the additional revenue that would have been recognized in these periods if the write-down to deferred revenue had not occurred in connection with the application of acquisition pushdown accounting. |
| (2) | Represents the impact of rent-related purchase accounting adjustments. In accordance with guidance in ASC 805 – Business Combinations, in connection with the 2012 Acquisition, the Company’s deferred rent liability was required to be written off as of the acquisition date and rent was recorded on a straight-line basis from the acquisition date through the end of the lease term. This resulted in higher overall recorded rent expense each period than would have otherwise been recorded had the deferred rent liability not been written off as a result of the acquisition push down accounting applied in accordance with ASC 805. Adjustments of $44, $105, $173 and $272 in the three and nine months ended September 30, 2019 and 2018, respectively, reflect the difference between the higher rent expense recorded in accordance with U.S. GAAP since the acquisition and the rent expense that would have been recorded had the 2012 Acquisition not occurred. Adjustments of $64, $93, $216 and $276 in the three and nine months ended September 30, 2019 and 2018, respectively, are due to the amortization of favorable and unfavorable leases. All of the rent related purchase accounting adjustments are adjustments to rent expense which is included in store operations on our consolidated statements of operations. |
| (3) | Represents the impact of a non-cash loss recorded in accordance with ASC 805 – Business Combinations related to our acquisition of six franchisee-owned stores on January 1, 2018. The loss recorded under GAAP represents the difference between the fair value of the reacquired franchise rights and the contractual terms of the reacquired franchise rights and is included in other (gain) loss on our consolidated statements of operations. |
| (4) | Represents transaction fees and expenses that could not be capitalized related to the issuance of our Series 2018-1 Senior Notes in the three and nine months ended September 30, 2018. |
| (5) | Represents a loss on extinguishment of debt related to the write-off of deferred financing costs associated with the Term Loan B that the Company repaid in August 2018. |
| (6) | Represents severance expense recorded in connection with an equity award modification. |
| (7) | Represents costs associated with new corporate-owned stores incurred prior to the store opening, including payroll-related costs, rent and occupancy expenses, marketing and other store operating supply expenses. |
| (8) | Represents gains and losses related to the adjustment of our tax benefit arrangements primarily due to changes in our effective tax rate. |
| (9) | Represents certain other charges and gains that we do not believe reflect our underlying business performance. In the nine months ended September 30, 2018, this amount includes expense of $590 related to the write off of certain assets that were being tested for potential use across the system. |
| (10) | Includes $3,096, $3,096, $9,288 and $9,288 of amortization of intangible assets, other than favorable leases, for the three and nine months ended September 30, 2019 and 2018, respectively, recorded in connection with the 2012 Acquisition, and $1,052, $838, $2,867 and $2,488 of amortization of intangible assets for the three months ended September 30, 2019 and 2018, respectively, recorded in connection with historical acquisitions of franchisee-owned stores. The adjustment represents the amount of actual non-cash amortization expense recorded, in accordance with U.S. GAAP, in each period. |
| (11) | Represents corporate income taxes at an assumed effective tax rate of 26.6% and 26.3% for the three and nine months ended September 30, 2019 and 2018, respectively, applied to adjusted income before income taxes. |
| (12) | Assumes the full exchange of all outstanding Holdings Units and corresponding shares of Class B common stock for shares of Class A common stock of Planet Fitness, Inc. |
A reconciliation of net income per share, diluted, to Adjusted net income per share, diluted is set forth below for the three and nine months ended September 30, 2019 and 2018:
| For the three months ended September 30, 2019 | For the three months ended September 30, 2018 | |||||||||
| (in thousands, except per share amounts) | Net income | Weighted Average Shares | Net income per share, diluted | Net income | Weighted Average Shares | Net income per share, diluted | ||||
| Net income attributable to Planet Fitness, Inc.(1) | $ | 25,777 | 83,807 | $ | 0.31 | $ | 17,471 | 88,458 | $ | 0.20 |
| Assumed exchange of shares(2) | 3,915 | 8,579 | 3,001 | 10,004 | ||||||
| Net Income | 29,692 | 20,472 | ||||||||
| Adjustments to arrive at adjusted income before income taxes(3) | 15,346 | 17,072 | ||||||||
| Adjusted income before income taxes | 45,038 | 37,544 | ||||||||
| Adjusted income taxes(4) | 11,980 | 9,874 | ||||||||
| Adjusted Net Income | $ | 33,058 | 92,386 | $ | 0.36 | $ | 27,670 | 98,462 | $ | 0.28 |
| (1) | Represents net income attributable to Planet Fitness, Inc. and the associated weighted average shares, diluted of Class A common stock outstanding. |
| (2) | Assumes the full exchange of all outstanding Holdings Units and corresponding shares of Class B common stock for shares of Class A common stock of Planet Fitness, Inc. Also assumes the addition of net income attributable to non-controlling interests corresponding with the assumed exchange of Holdings Units and Class B common shares for shares of Class A common stock. |
| (3) | Represents the total impact of all adjustments identified in the adjusted net income table above to arrive at adjusted income before income taxes. |
| (4) | Represents corporate income taxes at an assumed effective tax rate of 26.6% and 26.3% for the three months ended September 30, 2019 and 2018, respectively, applied to adjusted income before income taxes. |
| For the nine months ended September 30, 2019 | For the nine months ended September 30, 2018 | |||||||||
| (in thousands, except per share amounts) | Net income | Weighted Average Shares | Net income per share, diluted | Net income | Weighted Average Shares | Net income per share, diluted | ||||
| Net income attributable to Planet Fitness, Inc.(1) | $ | 88,030 | 84,354 | $ | 1.04 | $ | 63,226 | 88,064 | $ | 0.72 |
| Assumed exchange of shares(2) | 13,128 | 8,799 | 11,158 | 10,551 | ||||||
| Net Income | 101,158 | 74,384 | ||||||||
| Adjustments to arrive at adjusted income before income taxes(3) | 45,939 | 43,710 | ||||||||
| Adjusted income before income taxes | 147,097 | 118,094 | ||||||||
| Adjusted income taxes(4) | 39,128 | 31,059 | ||||||||
| Adjusted Net Income | $ | 107,969 | 93,153 | $ | 1.16 | $ | 87,035 | 98,615 | $ | 0.88 |
| (1) | Represents net income attributable to Planet Fitness, Inc. and the associated weighted average shares, diluted of Class A common stock outstanding. |
| (2) | Assumes the full exchange of all outstanding Holdings Units and corresponding shares of Class B common stock for shares of Class A common stock of Planet Fitness, Inc. Also assumes the addition of net income attributable to non-controlling interests corresponding with the assumed exchange of Holdings Units and Class B common shares for shares of Class A common stock. |
| (3) | Represents the total impact of all adjustments identified in the adjusted net income table above to arrive at adjusted income before income taxes. |
| (4) | Represents corporate income taxes at an assumed effective tax rate of 26.6% and 26.3% for the nine months ended September 30, 2019 and 2018, respectively, applied to adjusted income before income taxes. |
Hot Spot Ads
- BLS Certification in Augusta – AHA CPR Classes Only $59 or 2 for $99 at Pulse CPR

- Premier CPR & First Aid Training in Augusta, GA: Pulse CPR & First Aid School”

- Master Life-Saving Skills: American Heart Association CPR, First Aid, AED, BLS, ACLS, and PALS Training in Augusta, GA at Pulse CPR and First Aid School!

- The Ultimate Keto Meal Plan

- 300 Vegan/Plant Based Recipe Cook Book

- Kaldi Goats Coffee

- Giraffe Nuts CBD ( Post Workout Recovery)

- TIRED OF BEING OVERWEIGHT?

- Pulse Fitness Martinez
- Latest CBD Gummies and Oils!

- Bye-Bye Belly Fat!

- Hardest thing about weight loss is keeping it gone after you lose it!

- Plank Trainer…Planks don’t just work your core: They work your entire body.

- Click here —>Revenue-Based Gym Financing: How a Revenue-Based Gym Loan Works

- 4 Signs it’s Time to Hire a Lead Generation Company for your Gym.

- Dr. Esselstyn’s Prevent & Reverse Heart Disease Program

- Xponential Fitness grew from one man’s dream to a boutique fitness powerhouse Flip through the digital issue:

- Debra Strougo co-founded Row House with her husband, Eric Von Frohlich, and built it into one of the hottest studios in the business.

- Is The 1 Minute Weight Loss Program The Solution For You?

- Bodybuilding Beef Jerky!

- Feetlu Foldable Exercise Mat

- Delicious, Easy-To-Make Smoothies For Rapid Weight Loss & Incredible Health!

- My Daily Choice

- Buy Plus!

- Plexus Success

- Ornery Onion Company

- Cross Gym Resistance Bands

- Do You Need to Lose 15 to 100 lbs or More?

- Transform your body without starving yourself.

- Custom Keto Diet

- Take control of your days with Daily Sprays from MyDailyChoice.

Need more energy? BOOST Energy Spray gives you the jumpstart you need upon waking, through your exercise routine, or a long day of work.
- Genuine Organic Broad Spectrum Hemp CBD Oil

- HempWorx!…

- New Crystal Powered EMF Radiation Harmonizing Protectors.

- Slenderiiz Weight Loss!

- Wherever You Go, Go Safe And Be Well.

- Vitamix E310 Explorian Blender, Professional-Grade, 48 oz. Container, Black
- ODD 5 SECOND WATER “HACK” kills food cravings and MELTS 62 lbs

- How does DEEP SLEEP make you LOSE WEIGHT? See what a 2 minute after dinner ritual can do for you!

- HEALTHY HIGH PERFORMANCE FROM THE INSIDE OUT

- Full Spectrum CBD Oil by Danker Co

- GET YOUR CUSTOM KETO DIET PLAN

- Naternal products are made from natural sources.

- CPR Online During The Covid Shut Down

- Weight Loss & So Many More Health Benefits!

- Must Have Mint Collection

- Get Slimmer! Get Paid To Lose Weight.

- How One Woman Discovered the Female Fat-Loss Code Missed by Modern Medicine And Lost 84lbs Using a Simple 2-Step Ritual That 100% Guarantees Shocking Daily Weight Loss

Cinderella Solution Female Weight Loss System
- Don’t Let Your Doubts Sabotage Your Actions!

- PREMIUM CBD PRODUCTS DEVELOPED FOR YOUR LIFESTYLE

- Organifi Green Juice

- Keto Meal Plan Just For You!

- CTFO…Weight Loss Meal Replacement Shakes.

- Nutraleaves

- EBOOK EXPOSES HOW CBD HEMP OIL COULD GET RID OF ANXIETY, STRESS AND CHRONIC PAIN IN 10 MINUTES.

- Lotionex

- Oncali….relax responsibly authentic cbd with simple ingredients.

- AVL Supplements and Apparel

- THE LEAF NY
HEMP OIL & CBD
- THE BEST CBD PRODUCTS

- USA CBD Experts!

- LEPTITOX

- Buy Pure CBD Products Online! Legal Cannabidiol, NO THC.

- Experience Morocco. Truly.

- Discover HB Naturals CBD and Black Seed Oil Organic Products

- A New and Exciting Experience With MyDailyChoice!

- Changing the Futures Outcome CBD Oil

- Qberry Farms

- Your trusted source for quality SARM and SERM products

- SECRET REVEALED!Discover how more than 4 million American’s kill their anxiety on a daily basis.

- Aomega Best Hemp…From Our Fields To Your Family

- Vitamin Supplement Guide

This site is dedicated to helping you choose the right vitamin supplements for better health.
- Cinderella Solution System

- CBD BIOCARE

- What’s the Difference Between Success and Failure on the Keto Diet…

 Advertise
- Advertise your Affiliate Marketing product on Health Club News for $5MUST READ....Very Limited Time on this amazing offer...I promise this will not be up for long because we lose money on this offer...but it's worth it to us to allow you to experience what Health Club News is all about. We want you to be a customer for years to come. www.healthclubnews.org Advertise your CLICKBANK, […]
- Advertise your clickbank product on Health Club News for one week for $5Advertise With Us: Target Market Of Diet & Weight Loss Customers For Only $1 Here’s your Special Invitation to advertise your clickbank Product, Supplement, eBook or Service. Attract targeted customers to visit your site and spend money on a new items. Health Club News: We are growing each month in popularity and currently Ranking #1 […]
- Advertise your banner on my travel blog for $1Advertise With Us: Target Market Of Diet & Weight Loss Customers For Only $1 Here’s your Special Invitation to advertise on our top travel site, advertise your service, product ,eBook or travel Service. Attract targeted customers to visit your site and spend money on a new items.http://margaritavillenow.com/ Margaritaville Now is growing each month in popularity […]
- Drive 300 niche targeted USA traffic to your website or product each day for $10I will do a campaign to help you generate unique visitors to your link or website. This will be 90% USA / Canada and Europe visitors from sites like bing, google, facebook, twitter, instagram, tumblr, quora, niche blogs...We are connected to a well-known Advertising Network and an SEO professional with extensive background in online marketing […]
- Advertise your weight loss site for $5Weight Loss Advertising. Advertise With Us: Target Market Of Diet & Weight Loss Customers For Only $5 with Guaranteed Real Traffic Boost. Here’s your Special Invitation to advertise your Weight Loss or Diet Product, Supplement, eBook or Service. Attract targeted customers to visit your site and spend money on a new health related items. Banz […]
- Promote and advertise your affiliate product for $5Advertise With Us: Target Market Of Clickbank or Affiliate Marketing Customers For Only $5 with Guaranteed Real Traffic Boost. Here’s your Special Invitation to advertise your Clickbank or Affiliate Marketing Product, Supplement, eBook or Service. Attract targeted customers to visit your site and spend money on a new Clickbank or Affiliate Marketing related items. We […]
- Advertise Your Fitness and Weight Loss Product or Site for $5Advertise Your Fitness and Weight Loss Product or Site Advertise With Us: Target Market Of Diet & Weight Loss Customers For Only $10 with Guaranteed Real Traffic Boost. Here’s your Special Invitation to advertise your Weight Loss or Diet Product, Supplement, eBook or Service. Attract targeted customers to visit your site and spend money on […]
Club Solutions Health Club News Stories
- Orangetheory Fitness Announces Expansion into Italy
- Aligned Fitness Acquires Six Club Pilates Studios, Expands Presence Into New Jersey
- Crunch Fitness Launches Crunch Reform Pilates
- They Left. Now What? How Fitness Clubs are Winning Back Former Members
- 7 Things Mark Mastrov Wants Every Gym Operator to Know Right Now
- World Gym Corporation Partners with HYROX to Accelerate Fitness Racing Across Taiwan, with Expansion in Thailand
- Growing Revenue Without Sacrificing the Member Experience
- Economic Clarity, AI Strategy and Honest Conversations at the 2026 Club Solutions Leadership Summit
Health Club News Feed
- Untitled
- BLS Certification in Augusta – AHA CPR Classes Only $59 or 2 for $99 at Pulse CPR
- 25 Women Needed for 36-Week Weight-Loss Study
- Crunch Fitness Brings State-of-the-Art 3.0 Facility to Madera, California
- Fitness Ventures Expands South Texas Footprint With Three New Crunch Locations
- Health Club News: Your Ultimate Source for Health Club, Gym, Spa, and Fitness Franchise Industry Intelligence
- Best of the Best Gym/Health Club: YMCA
- Tom Leverton Named CEO of Purpose Brands, Leading Global Growth in Health and Wellness
- Premier CPR & First Aid Training in Augusta, GA: Pulse CPR & First Aid School”
- Unveiling Health Club News: Your Ultimate Hub for Fitness Industry Updates