
BASIC-FIT: REPORTS HALF-YEAR 2017 RESULTS
BASIC-FIT: Reports better than expected numbers…Click Here to see full report1 AUGUST 2017 – H1 2017 RESULTS / 1
BASIC-FIT REPORTS HALF-YEAR 2017 RESULTS
Continued strong growth in clubs and revenue; robust club EBITDA margin at 43.3%
H1 FINANCIAL HIGHLIGHTS
Revenue increased by 26% to €156 million (H1 2016: €124 million)
Other revenue increased by 34% to €3.3 million (H1 2016: €2.5 million)
Club EBITDA margin remains strong at 43.3% (H1 2016: 43.3%)
Adjusted EBITDA increased by 23% to €45.5 million (H1 2016: €37.2 million)
Adjusted net earnings1 were €10.3 million (H1 2016: €2.7 million)
H1 OPERATIONAL HIGHLIGHTS
47 net club openings year to date, growing network to 466 clubs (up 11% in H1 2017 and
27% year on year)
Total number of memberships increased to 1.36 million (up 13% in H1 2017 and 22% year
on year)
Sports water subscriptions doubled to 18% of membership base (H1 2016: 9%)
MEDIUM-TERM OUTLOOK
The club openings pipeline for the remainder of 2017 and 2018 is well filled
We remain confident to grow our network by around 100 clubs in 2017 and onwards
Unchanged target of return on invested capital on mature clubs of at least 30%
Rene Moos, CEO Basic-Fit:
Basic-Fit had a strong first half of the year in which we delivered on the accelerated growth
plans and maintained our high margins. The club EBITDA margin remained strong at 43.3%
despite the large number of new club openings.
The development of add-on revenue was encouraging. Our members appreciate the additional
options that we offer to optimise their fitness experience. More members now add a sports
water or PRO APP subscription to their memberships which contributed to a higher average
yield per member.
The club openings pipeline remains strong with most clubs planned to be opened in France. With
47 net club openings, we are on track to open around 100 clubs this year. In 2016 and the first
half of this year club openings were back-end loaded. Because of this and the many new clubs
that are now ramping up memberships, we expect to benefit from operating leverage and
adjusted EBITDA growth to accelerate in the second half of 2017.
Note: Adjusted (club) EBITDA, adjusted net earnings and leverage ratio are non-GAAP measures (see page 7)
1
Net earnings adjusted for amortisation, interest on shareholder loans, exceptional items and one-offs and the related tax
effects (25%)
11 AUGUST 2017 – H1 2017 RESULTS / 2
FINANCIAL AND BUSINESS REVIEW
Key figures
* Before amortisation, interest on shareholder loans, exceptional items and one-offs and the related tax effects
Totals are based on non-rounded figures
CLUB AND MEMBERSHIP DEVELOPMENT
Geographic club split
In the first half of the year we opened 51 clubs and closed 4 clubs resulting in 47 net additions
to our network. Of the four clubs that we closed, three were part of prior larger acquisitions
and planned to close upon expiration of the lease contracts. One club has been temporarily
closed whilst the landlord is doing necessary construction work on the property.
At the end of the period we operated 466 clubs compared to 368 clubs a year ago; an increase
of 98 clubs. In France, we increased the number of clubs by 70 compared to a year ago. In
Belgium, the Netherlands and Spain we added 15, 9 and 4 clubs respectively to our network.
The total number of memberships in the first half of the year increased to 1.36 million
compared to 1.21 million at the end of 2016 and 1.12 million a year ago. Our 249 mature clubs2
showed a robust membership development with 3,307 members on average per club.
2
At the start of the year we had 252 clubs in our network which were 24 months or older. During the first half year, we closed 3
mature clubs as planned which resulted in the current 249 mature clubs
11 AUGUST 2017 – H1 2017 RESULTS / 3
REVENUE
In the first half of 2017, revenue increased by 26% to €156 million compared to €124 million in
the same period last year. Both fitness revenue and other revenue contributed to this growth
by 26% and 34% respectively. The ramp up of memberships at our existing clubs and the new
club openings were the main drivers for the increase of fitness revenue. The increase of other
revenue was mainly the result of personal trainers being made available in more clubs and
higher sales of day passes.
Geographic revenue split
Totals are based on non-rounded figures
All countries showed strong revenue growth compared to H1 2016. In France, we delivered
revenue growth of 181% due to the large number of club openings and the memberships rampup at immature clubs.
The average yield per member per month increased to €19.76 compared to €19.51 in the first
half of 2016. The take-up of add-on subscriptions and the increased maturity of our
membership base more than compensated for the high VAT rate in France.
CLUB EBITDA AND ADJUSTED EBITDA
On a club level, EBITDA increased by 26% to €67.5 million, representing a club EBITDA margin of
43.3% (H1 2016: 43.3%). The stable margin was the result of the increased yield per member
and the larger number of mature clubs in the mix which compensated for the large number of
club openings in the period.
Total operating expenses on a club level increased to €88.5 million from €70.1 million in H1
2016, which is mainly the result of the growth in the number of clubs. The increase in club
operating costs in France, mainly due to local taxes, were offset by higher membership levels.
Adjusted EBITDA increased by 23% to €45.5 million compared to €37.2 million in H1 2016. The
adjusted EBITDA margin decreased to 29.2% compared to 30.0% in the same period last year,
as a result of higher overhead costs. Total overhead expenses increased to €21.9 million
compared to €16.5 million in H1 2016, due to the further professionalisation of the organisation
to facilitate further growth. The international build-out of overhead occurred throughout 2016,
with the full impact in costs in 2017. In addition, higher marketing spend relating to the new
club openings in France in the period accounted for €1.2 million of the increase.
11 AUGUST 2017 – H1 2017 RESULTS / 4
EBITDA AND EXCEPTIONAL ITEMS
Total EBITDA of the group increased by 43% to €43.3 million compared to €30.2 million in H1
2016.
Exceptional items totalled €2.2 million compared to €6.9 million in H1 2016 and mainly
comprised of non-cash pre-opening costs and costs related to the retention share plan awarded
to key people after the IPO. In H1 2016 the exceptional items also included the IPO and
refinancing costs.
INTEREST AND NET DEBT
The finance expenses in the first half of the year decreased to €3.6 million compared to €32.5
million in the same period in 2016, as a result of the new facilities agreement we entered into
at the time of the IPO, with significantly improved terms. In addition, the finance expenses in
H1 2016 included costs (€12 million) related to the early repayment of prior loans and lease
commitments.
At the end of the period our net debt was €248 million compared to €206 million at the end of
2016. The increase is the result of the large number of club openings in line with the announced
accelerated execution of our growth strategy. The leverage ratio3 at the end of the period was
2.8, within the bandwidth of 2.5 to 3.0 times adjusted EBITDA as communicated in March. Our
financial position provides the flexibility to continue to execute our growth strategy at the
current high pace.
CORPORATE TAX
In the first half of the year, the corporate tax expenses amounted to €2.0 million (H1 2016: tax
income of €7.7 million) representing an effective tax rate of 47% compared to 23% in H1 2016.
The increase in the effective tax rate is mainly explained by the reassessment of deferred tax
assets and liabilities after a tax rate reduction in France (16% points impact) and some non tax
deductible expenses (7% points impact). We expect to start paying cash taxes from 2018
onwards.
ADJUSTED NET EARNINGS
The net profit in the first half of the year was €2.2 million compared to a net loss of €26.1
million in H1 2016.
Adjusted net earnings4 increased to €10.3 million compared to €2.7 million in H1 2016.
The one-off costs which we incurred in H1 2016 were related to the IPO and the refinancing and
early repayment of our financial leases.
3
Net debt/LTM adjusted EBITDA
4
Net earnings adjusted for amortisation, interest on shareholder loans, exceptional items and one-offs and the related tax
effects (25%)
11 AUGUST 2017 – H1 2017 RESULTS / 5
Reconciliation net result to adjusted net earnings
Totals are based on non-rounded figures
EQUITY
Total equity at the end of the period was €308 million compared to €305 million at the end of
2016.
WORKING CAPITAL
Working capital at the end of the period was €75.4 million negative compared to €82.1 million
negative at the end of 2016. As communicated in March, we have been reducing our negative
working capital as a percentage of (LTM) revenue; working capital as a percentage of revenue
was minus 26% compared to minus 32% at the end of 2016. In the second half of the year we
expect working capital as a percentage of revenue to remain around minus 25%.
CASH FLOW & CAPITAL EXPENDITURE
The cash flow pre-expansion capex, defined as adjusted EBITDA minus maintenance capex, was
€32.9 million, an increase of 10% compared to €29.9 million in H1 2016.
Maintenance capex in H1 2017 was €12.6 million compared to €7.3 million in H1 2016. This
translates into an average of €28 thousand maintenance costs per club. We continue to expect
maintenance capex of around €55 thousand per club for the full year.
Expansion capex in the period was €59.6 million compared to €40.8 million in H1 2016. The
increase is explained by the 51 clubs we opened in the period compared to 31 clubs in H1 2016.
The expansion capex includes the expenses for the expansion of existing clubs, expenses for yet
to open clubs and acquired clubs totalling €5.3 million (H1 2016: €2.7 million). In the period, we
acquired 2 clubs. On the 49 clubs that we built ourselves in the first half of the year, we spent
€54.3 million which is on average €1.1 million per club (H1 2016: €1.1 million).
Other capex was €1.9 million compared to €2.2 million in H1 2016. In the period, other capex
mainly consisted of investments in innovations and software development.
11 AUGUST 2017 – H1 2017 RESULTS / 6
OUTLOOK
Club openings pipeline (# clubs)
* Contracts signed includes sites for which we are awaiting permit approval
With the 47 clubs added to the network in the first half of the year and 71 clubs under
construction or for which contracts are signed, we are well under way to open the 100 clubs in
2017 as guided in March. We continue to fill the pipeline for club openings in 2018 and beyond.
We rigidly follow our well-defined expansion process to secure the high quality of our network
and to achieve the targeted return on invested capital on mature clubs of at least 30%
— END —
FOR MORE INFORMATION
Richard Piekaar
+31 (0)23 302 23 85
investor.relations@basic-fit.com
The full half year report including notes to the interim condensed consolidated financial statements is
available on Basic-Fit’s corporate website.
AUDIO WEBCAST HALF YEAR 2017 RESULTS
Date and time: 11 August 2017 at 14.00 CET
corporate.basic-fit.com
Basic-Fit is listed on Euronext Amsterdam in the Netherlands
ISIN: NL0011872650 Symbol: BFIT
FINANCIAL CALENDAR
Q3 trading update 2 November 2017 FY 2017 results 13 March 2018
Investor Day 9 November 2017 Q1 2018 trading update & AGM 23 April 2018
ABOUT BASIC-FIT
With 466 clubs, Basic-Fit is the largest fitness operator in Europe. We operate in five countries and in our clubs, more than 1.3
million people work on improving their fitness. Basic-Fit operates a straightforward membership model and offers a highquality, value-for-money fitness experience that appeals to the fitness needs of all active people who care about their personal
health and fitness. A typical subscription costs €19.99 a month and gives people access to all our clubs in Europe and a pass
which can be shared with family members.
47
30 41
0
20
40
60
Net openings YTD Under
construction
Contracts signed*
11 AUGUST 2017 – H1 2017 RESULTS / 7
NOTES TO THE PRESS RELEASE
The interim condensed consolidated financial statements are presented in millions of euros and all values are rounded to the
nearest million unless otherwise stated. Change percentages and totals are calculated before rounding. As a consequence,
rounded amounts may not add up to the rounded total in all cases.
This press release contains inside information within the meaning of Article 7(1) of the EU Market Abuse Regulation.
NON-IFRS FINANCIAL MEASURES
The financial information in this report includes non-IFRS financial measures and ratios (e.g. club EBITDA, adjusted EBITDA,
exceptional items, adjusted net earnings and net debt) which are not recognised measures of financial performance or liquidity
under IFRS. In addition, certain other operational data, such as the number of clubs, number of members and number of
countries in which Basic-Fit is present, are disclosed. The non-IFRS financial measures presented are measures used by
management to monitor the underlying performance of the business and operations and, have therefore not been audited or
reviewed. Furthermore, they may not be indicative of the historical operating results, nor are they meant to be predictive of
future results. These non-IFRS measures are presented because they are considered important supplementary measures of
Basic-Fit’s performance, and we believe that these and similar measures are widely used in the industry in which Basic-Fit
operates as a way to evaluate a company’s operating performance and liquidity. Not all companies calculate non-IFRS financial
measures in the same manner or on a consistent basis. As a result, these measures and ratios may not be comparable to
measures used by other companies under the same or similar names.
FORWARD-LOOKING STATEMENTS / IMPORTANT NOTICE
Some statements in this press release may be considered ’forward-looking statements’. By their nature, forward-looking
statements involve risk and uncertainty because they relate to events and depend on circumstances that may occur in the
future. These forward-looking statements involve known and unknown risks, uncertainties and other factors that are outside of
our control and impossible to predict and may cause actual results to differ materially from any future results expressed or
implied. These forward-looking statements are based on current expectations, estimates, forecasts, analyses and projections
about the industry in which we operate and management’s beliefs and assumptions about possible future events. You are
cautioned not to put undue reliance on these forward-looking statements, which only express views as at the date of this press
release and are neither predictions nor guarantees of possible future events or circumstances. We do not undertake any
obligation to release publicly any revisions to these forward-looking statements to reflect events or circumstances after the
date of this press release or to reflect the occurrence of unanticipated events, except as may be required under applicable
securities law.
11 AUGUST 2017 – H1 2017 RESULTS / 8
Interim condensed consolidated statement of comprehensive income
Consolidated statement of profit or loss
(In € x 1,000)
30 June 2017
Unaudited
30 June 2016
Unaudited
Revenue 155,974 123,760
155,974 123,760
Costs of consumables used (2,010) (1,102)
Employee benefits expense (29,585) (24,490)
Depreciation, amortisation and impairment charges (35,467) (31,557)
Other operating income 169 240
Other operating expenses (81,259) (68,185)
Operating profit 7,822 (1,334)
Finance income 5 7
Finance costs (3,632) (32,475)
Finance costs – net (3,627) (32,468)
Profit (loss) before income tax 4,195 (33,802)
Income tax (1,967) 7,735
Profit (loss) for the period attributable to the owners of the
company 2,228 (26,067)
Earnings per share for profit attributable to the ordinary equity
holders of the company:
Basic earnings per share (in €) 0.04 (0.80)
Diluted earnings per share (in €) 0.04 (0.80)
(in € x 1,000)
30 June 2017
Unaudited
30 June 2016
Unaudited
Profit (loss) for the period attributable to the owners of the
company 2,228 (26,067)
| Other comprehensive income Items that may be reclassified to profit or loss Cash flow hedges |
333 | 125 |
| Deferred tax on cash flow hedges | (83) | (31) |
Other comprehensive income for the period, net of tax 250 94
Total comprehensive income for the period attributable to owners of
the company 2,478 (25,973)
11 AUGUST 2017 – H1 2017 RESULTS / 9
Interim condensed consolidated statement of financial position
(In € x 1,000)
30 June 2017
Unaudited
31 December 2016
Audited
Assets
Non-current assets
| Property, plant and equipment | 374,335 | 329,290 |
| Intangible assets | 272,419 | 278,846 |
| Deferred tax assets | 5,550 | 4,590 |
| Receivables | 2,521 | 2,062 |
Total non-current assets 654,825 614,788
Current assets
Inventories 841 811
Trade and other receivables 19,975 19,595
Cash and cash equivalents 16,727 17,365
Total current assets 37,543 37,771
Total assets 692,368 652,559
Equity
Share capital 3,280 3,280
Share premium 358,360 358,360
Treasury shares (869) –
Other capital reserves 1,573 729
Retained earnings (54,229) (56,457)
Cash flow hedge reserve (585) (835)
Total equity 307,530 305,077
Liabilities
Non-current liabilities
Borrowings 172,776 172,711
Derivative financial instruments 875 1,367
Deferred tax liabilities 17,703 14,692
Provisions 3,719 4,185
Total non-current liabilities 195,073 192,955
Current liabilities
Trade and other payables 96,177 102,465
Current income tax liabilities 287 287
Current portion of borrowings 92,089 50,400
Provisions 1,212 1,375
Total current liabilities 189,765 154,527
Total liabilities 384,838 347,482
Total equity and liabilities 692,368 652,559
11 AUGUST 2017 – H1 2017 RESULTS / 10
Interim condensed consolidated statement of cash flow
(In € x 1,000)
30 June 2017
Unaudited
30 June 2016
Unaudited
Cash flows from operating activities
Profit (loss) before income tax 4,195 (33,802)
Non-cash adjustments to reconcile profit before tax to net cash flows:
Depreciation and impairment of property, plant and equipment 27,820 23,423
Amortisation and impairment of intangible assets 7,647 8,134
Share-based payment expense 844 –
Gain on disposal of property, plant and equipment (87) (194)
Finance income (5) (7)
Finance expense 3,632 32,475
Movements in provisions (629) (798)
Working capital adjustments:
| Decrease (increase) in inventories | (30) | 62 |
| Decrease (increase) in trade and other receivables | (380) | (10,165) |
| Increase (decrease) in trade and other payables | 5,237 | (7,744) |
Cash generated from operations 48,244 11,384
Interest received 5 7
Interest paid (3,588) (9,697)
Early repayment fees – (7,780)
Income tax received (paid) – (10)
Net cash flows from operating activities 44,661 (6,096)
Cash flows from investing activities
Proceeds from sale of property, plant and equipment 199 794
Purchase of property, plant and equipment (83,577) (50,603)
Purchase of other intangible assets (649) (1,550)
Acquisitions, net of cash acquired (1,364) (1,358)
Repayment of loans granted 13 13
Disinvestments (investments) in other financial fixed assets (472) 595
Net cash flows used in investing activities (85,850) (52,109)
Cash flows from financing activities
Proceeds from borrowings 42,761 192,500
Repayments of borrowings (966) (509,466)
Financing costs paid (375) (4,201)
Proceeds of newly issued shares (incorporation of Basic-Fit N.V.) – 45
IPO-proceeds – 370,000
Proceeds from share premium – 1,500
Purchase of treasury shares (869) –
Incremental costs paid directly attributable to IPO – (7,359)
Net cash flows from financing activities 40,551 43,019
Net increase (decrease) in cash and cash equivalents (638) (15,186)
Cash and cash equivalents at 1 January 17,365 12,328
Cash and cash equivalents at 30 June 16,727 (2,858)
Hot Spot Ads
- Master Life-Saving Skills: American Heart Association CPR, First Aid, AED, BLS, ACLS, and PALS Training in Augusta, GA at Pulse CPR and First Aid School!

- The Ultimate Keto Meal Plan

- 300 Vegan/Plant Based Recipe Cook Book

- Kaldi Goats Coffee
- Giraffe Nuts CBD ( Post Workout Recovery)

- TIRED OF BEING OVERWEIGHT?
- Pulse Fitness Martinez
- Latest CBD Gummies and Oils!

- Bye-Bye Belly Fat!

- Hardest thing about weight loss is keeping it gone after you lose it!

- Plank Trainer…Planks don’t just work your core: They work your entire body.
- Click here —>Revenue-Based Gym Financing: How a Revenue-Based Gym Loan Works

- Click here —>Revenue-Based Gym Financing: How a Revenue-Based Gym Loan Works

- 4 Signs it’s Time to Hire a Lead Generation Company for your Gym.

- Dr. Esselstyn’s Prevent & Reverse Heart Disease Program

- Xponential Fitness grew from one man’s dream to a boutique fitness powerhouse Flip through the digital issue:
- Debra Strougo co-founded Row House with her husband, Eric Von Frohlich, and built it into one of the hottest studios in the business.

- Is The 1 Minute Weight Loss Program The Solution For You?

- Bodybuilding Beef Jerky!

- Feetlu Foldable Exercise Mat

- Delicious, Easy-To-Make Smoothies For Rapid Weight Loss & Incredible Health!

- My Daily Choice

- Buy Plus!

- Plexus Success

- Ornery Onion Company

- Cross Gym Resistance Bands

- Do You Need to Lose 15 to 100 lbs or More?

- Transform your body without starving yourself.

- Custom Keto Diet

- Take control of your days with Daily Sprays from MyDailyChoice.
Need more energy? BOOST Energy Spray gives you the jumpstart you need upon waking, through your exercise routine, or a long day of work.
- Genuine Organic Broad Spectrum Hemp CBD Oil

- HempWorx!…

- New Crystal Powered EMF Radiation Harmonizing Protectors.

- Slenderiiz Weight Loss!

- Wherever You Go, Go Safe And Be Well.
- Vitamix E310 Explorian Blender, Professional-Grade, 48 oz. Container, Black
- ODD 5 SECOND WATER “HACK” kills food cravings and MELTS 62 lbs

- How does DEEP SLEEP make you LOSE WEIGHT? See what a 2 minute after dinner ritual can do for you!

- HEALTHY HIGH PERFORMANCE FROM THE INSIDE OUT

- Full Spectrum CBD Oil by Danker Co

- GET YOUR CUSTOM KETO DIET PLAN

- Naternal products are made from natural sources.

- CPR Online During The Covid Shut Down

- Weight Loss & So Many More Health Benefits!

- Must Have Mint Collection

- Get Slimmer! Get Paid To Lose Weight.

- How One Woman Discovered the Female Fat-Loss Code Missed by Modern Medicine And Lost 84lbs Using a Simple 2-Step Ritual That 100% Guarantees Shocking Daily Weight Loss

Cinderella Solution Female Weight Loss System
- Don’t Let Your Doubts Sabotage Your Actions!

- PREMIUM CBD PRODUCTS DEVELOPED FOR YOUR LIFESTYLE
- Organifi Green Juice

- Keto Meal Plan Just For You!

- CTFO…Weight Loss Meal Replacement Shakes.

- Nutraleaves

- EBOOK EXPOSES HOW CBD HEMP OIL COULD GET RID OF ANXIETY, STRESS AND CHRONIC PAIN IN 10 MINUTES.

- Lotionex

- Oncali….relax responsibly authentic cbd with simple ingredients.

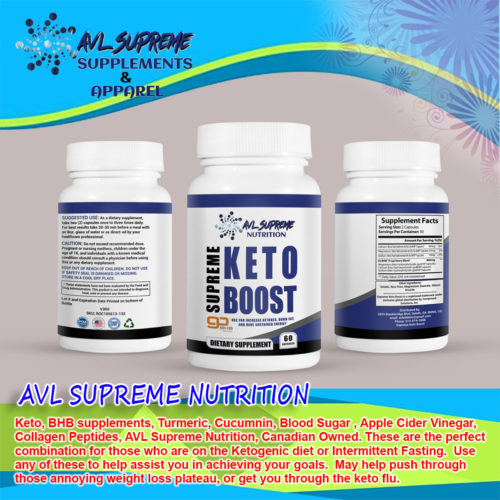
- AVL Supplements and Apparel
- THE LEAF NY
HEMP OIL & CBD
- THE BEST CBD PRODUCTS

- USA CBD Experts!

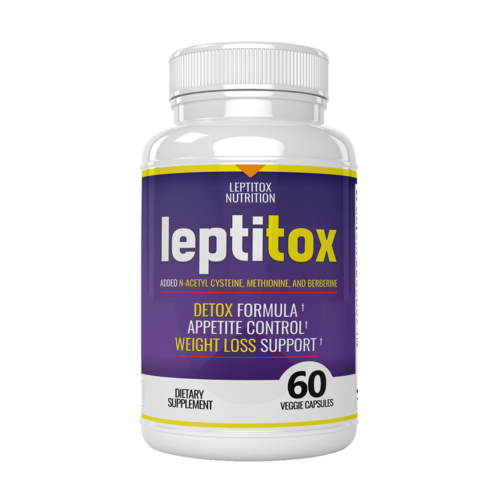
- LEPTITOX
- Buy Pure CBD Products Online! Legal Cannabidiol, NO THC.

- Experience Morocco. Truly.

- Discover HB Naturals CBD and Black Seed Oil Organic Products

- A New and Exciting Experience With MyDailyChoice!

- Changing the Futures Outcome CBD Oil

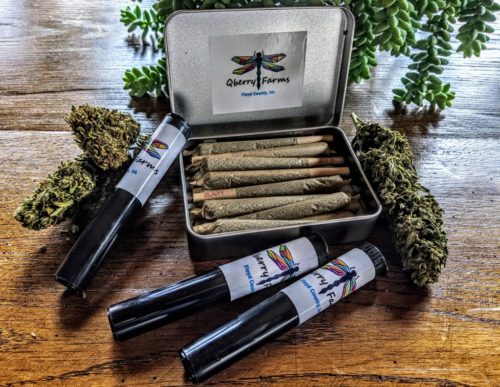
- Qberry Farms
- Your trusted source for quality SARM and SERM products

- SECRET REVEALED!Discover how more than 4 million American’s kill their anxiety on a daily basis.

- Aomega Best Hemp…From Our Fields To Your Family

- Vitamin Supplement Guide

This site is dedicated to helping you choose the right vitamin supplements for better health.
- Cinderella Solution System

- CBD BIOCARE

- What’s the Difference Between Success and Failure on the Keto Diet…
- Free Cbd 4 Life

 Advertise
- Advertise your Affiliate Marketing product on Health Club News for $5MUST READ....Very Limited Time on this amazing offer...I promise this will not be up for long because we lose money on this offer...but it's worth it to us to allow you to experience what Health Club News is all about. We want you to be a customer for years to come. www.healthclubnews.org Advertise your CLICKBANK, […]
- Advertise your clickbank product on Health Club News for one week for $5Advertise With Us: Target Market Of Diet & Weight Loss Customers For Only $1 Here’s your Special Invitation to advertise your clickbank Product, Supplement, eBook or Service. Attract targeted customers to visit your site and spend money on a new items. Health Club News: We are growing each month in popularity and currently Ranking #1 […]
- Advertise your banner on my travel blog for $1Advertise With Us: Target Market Of Diet & Weight Loss Customers For Only $1 Here’s your Special Invitation to advertise on our top travel site, advertise your service, product ,eBook or travel Service. Attract targeted customers to visit your site and spend money on a new items.http://margaritavillenow.com/ Margaritaville Now is growing each month in popularity […]
- Drive 300 niche targeted USA traffic to your website or product each day for $10I will do a campaign to help you generate unique visitors to your link or website. This will be 90% USA / Canada and Europe visitors from sites like bing, google, facebook, twitter, instagram, tumblr, quora, niche blogs...We are connected to a well-known Advertising Network and an SEO professional with extensive background in online marketing […]
- Advertise your weight loss site for $5Weight Loss Advertising. Advertise With Us: Target Market Of Diet & Weight Loss Customers For Only $5 with Guaranteed Real Traffic Boost. Here’s your Special Invitation to advertise your Weight Loss or Diet Product, Supplement, eBook or Service. Attract targeted customers to visit your site and spend money on a new health related items. Banz […]
- Promote and advertise your affiliate product for $5Advertise With Us: Target Market Of Clickbank or Affiliate Marketing Customers For Only $5 with Guaranteed Real Traffic Boost. Here’s your Special Invitation to advertise your Clickbank or Affiliate Marketing Product, Supplement, eBook or Service. Attract targeted customers to visit your site and spend money on a new Clickbank or Affiliate Marketing related items. We […]
- Advertise Your Fitness and Weight Loss Product or Site for $5Advertise Your Fitness and Weight Loss Product or Site Advertise With Us: Target Market Of Diet & Weight Loss Customers For Only $10 with Guaranteed Real Traffic Boost. Here’s your Special Invitation to advertise your Weight Loss or Diet Product, Supplement, eBook or Service. Attract targeted customers to visit your site and spend money on […]
Club Solutions Health Club News Stories
- BeaverFit: Your Trusted Partner
- Thought Leaders: Navigating Outdoor Fitness
- Freemotion Named the Premier Sponsor of the 2024 Club Solutions Leadership Retreat
- Q&A: Chris Smith on Fitness Industry Opportunities and Trends
- Colleen Keating Appointed as Planet Fitness CEO
- Leadership Viewpoint: EGYM on the Importance of Fundamentals
- Club Tour: Western Racquet and Fitness Club
- REP Fitness Announces Expansion into the European Market with a Direct-to-Consumer Approach
Health Club News Feed
- Master Life-Saving Skills: American Heart Association CPR, First Aid, AED, BLS, ACLS, and PALS Training in Augusta, GA at Pulse CPR and First Aid School!
- Master Life-Saving Skills: American Heart Association CPR, First Aid, AED, BLS, ACLS, and PALS Training in Augusta, GA at Pulse CPR and First Aid School!
- Life Time Opens Its First Location in Oregon: Life Time Beaverton, a Premier Athletic Club and Co-Working Space Spanning Over 235,000 Square Feet, Becomes the Company’s Largest Facility in 30 States and 42 Major U.S. Markets
- Jennifer Aniston Joins Forces with Pvolve for Partnership and Ad Campaign in Fitness Collaboration
- LA Fitness Takes Legal Action Against Related Companies for Equinox and SoulCycle Ventures
- David Barton Launches Gym U: The Ultimate Fitness Experience in Chelsea
- F45 Training Faces Mounting Pressure as NYSE Issues Second Notice of Non-Compliance
- “Crunch Columbus: Unveiling a $5 Million Fitness Oasis with State-of-the-Art Amenities!”
- Life Time Group Holdings, Inc. Completes $310 Million Refinancing and $45 Million Sale-Leaseback Deal, Upgrades Credit Rating
- “Equinox Agrees to Pay $11.25 Million Settlement in Race and Gender Discrimination Lawsuit, Addressing Claims of Unfair Treatment”